
Ask a foundation contractor what a lead costs and you’ll get an answer to the dollar. Eighty. Fifty-five. A hundred and twenty.
Ask the same owner what a signed job costs, and the room goes quiet.
That silence is where the money is, so let’s walk through one month of a typical account and watch the number change shape. The figures below are rounded for the walkthrough; the pattern is what I see in real accounts constantly.
A month on one napkin
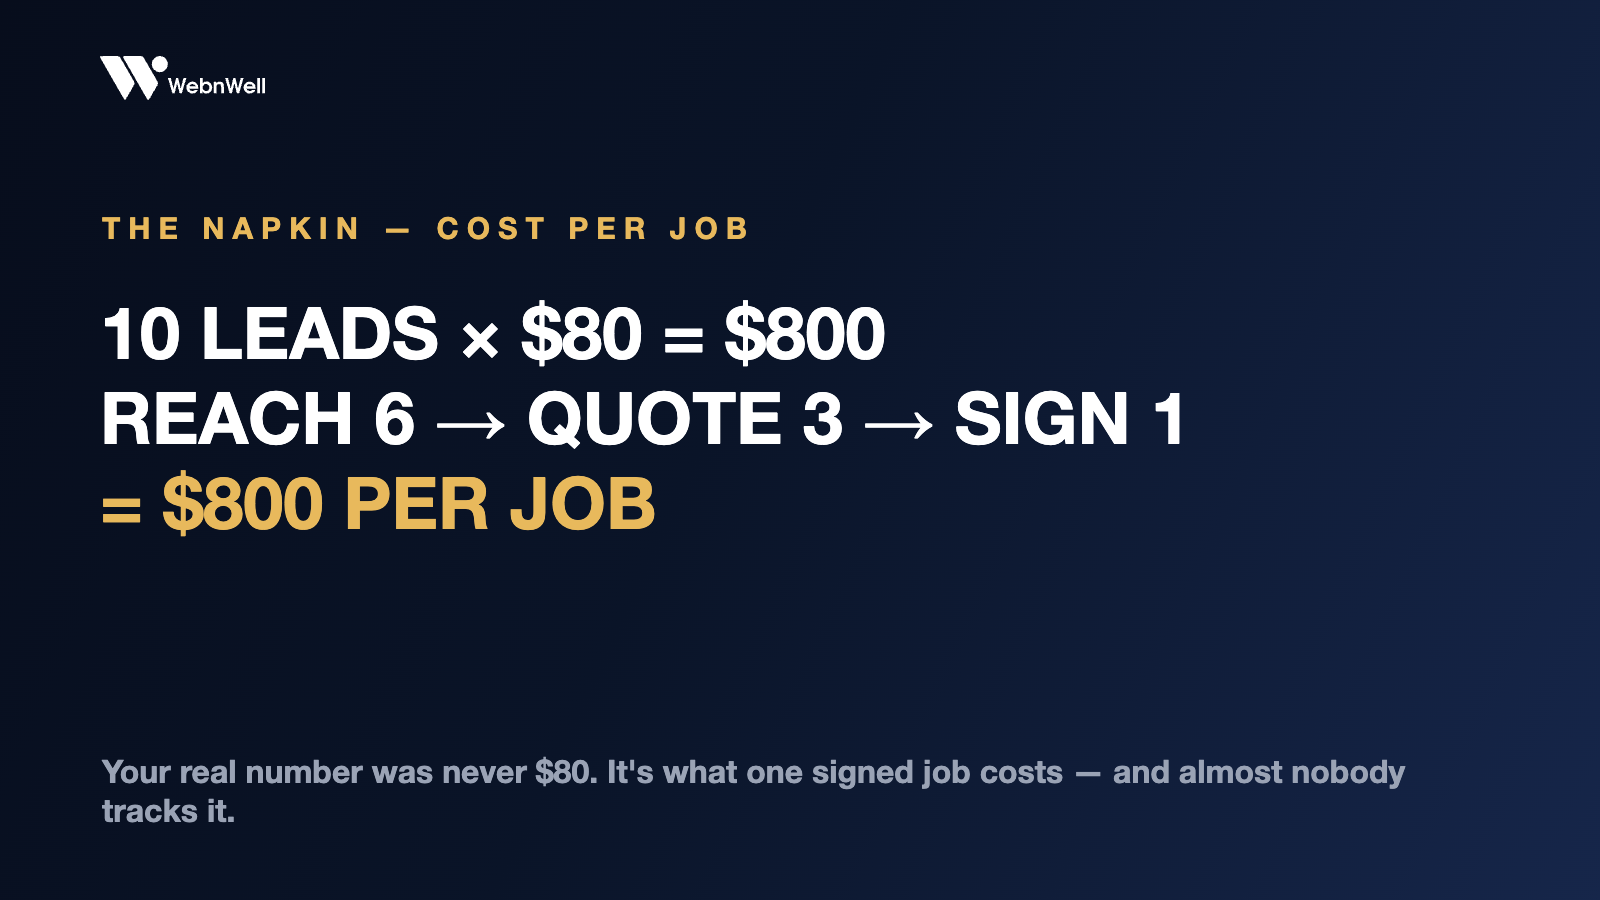
You buy ten leads at $80. That’s $800 out the door, and your cost per lead is $80, which is the number the vendor will happily discuss with you.
Now follow what happens to those ten. You reach six of them. Two answered on the first call; the other four took chasing, and four more never picked up at all. Of the six conversations, three turn into site visits and quotes. Of the three quotes, one signs.
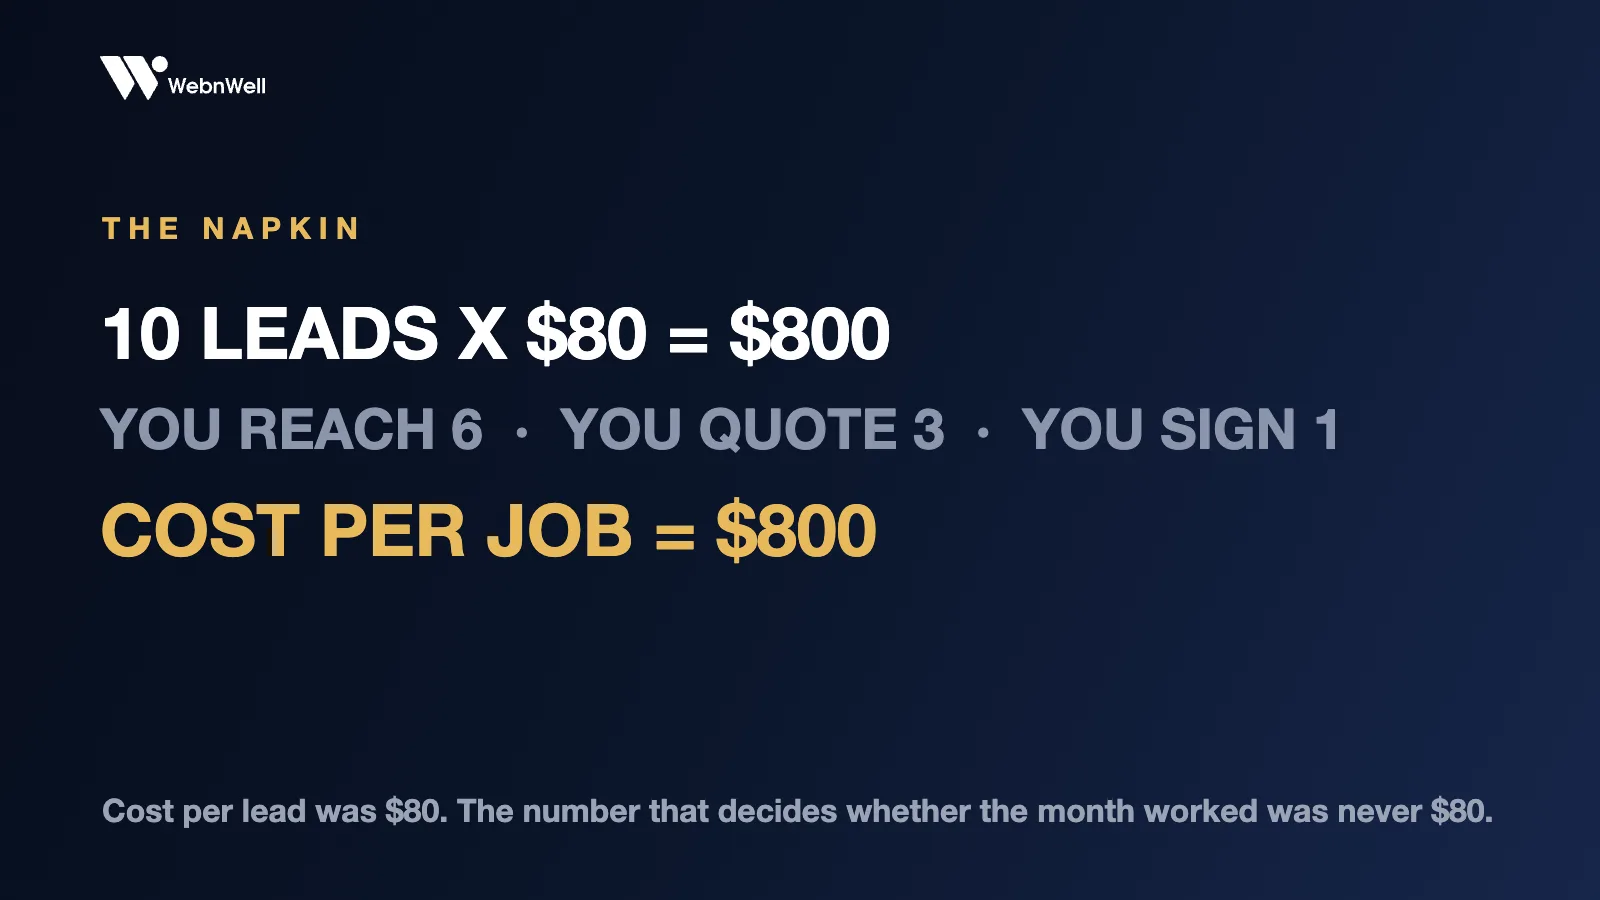
One job from $800 of spend. Your cost per job is $800, and whether that was a great month or a disaster depends entirely on what the job was worth. A $14,000 pier contract? Buy more leads tomorrow. A $2,200 crack injection? You worked for the lead vendor this month.
Notice that neither verdict was visible from the $80. A lead price is quoted to you; a job price is produced by you. Two contractors buying identical leads at identical prices routinely end up with numbers three times apart, and the difference is never the vendor.
Now the vendor calls with a deal
Somebody offers you leads at $50 instead of $80. Thirty-seven percent saving, right there on the invoice.
Except the $50 lead is a shared lead. The same homeowner’s number goes to three or four contractors at once, so she’s fielding four calls in ten minutes and comparing all of you before you’ve said your name. Your close rate on those tends to fall hard. Close one in eight and the bargain lead costs you $400 per job. The $80 exclusive lead closing one in three costs $240.
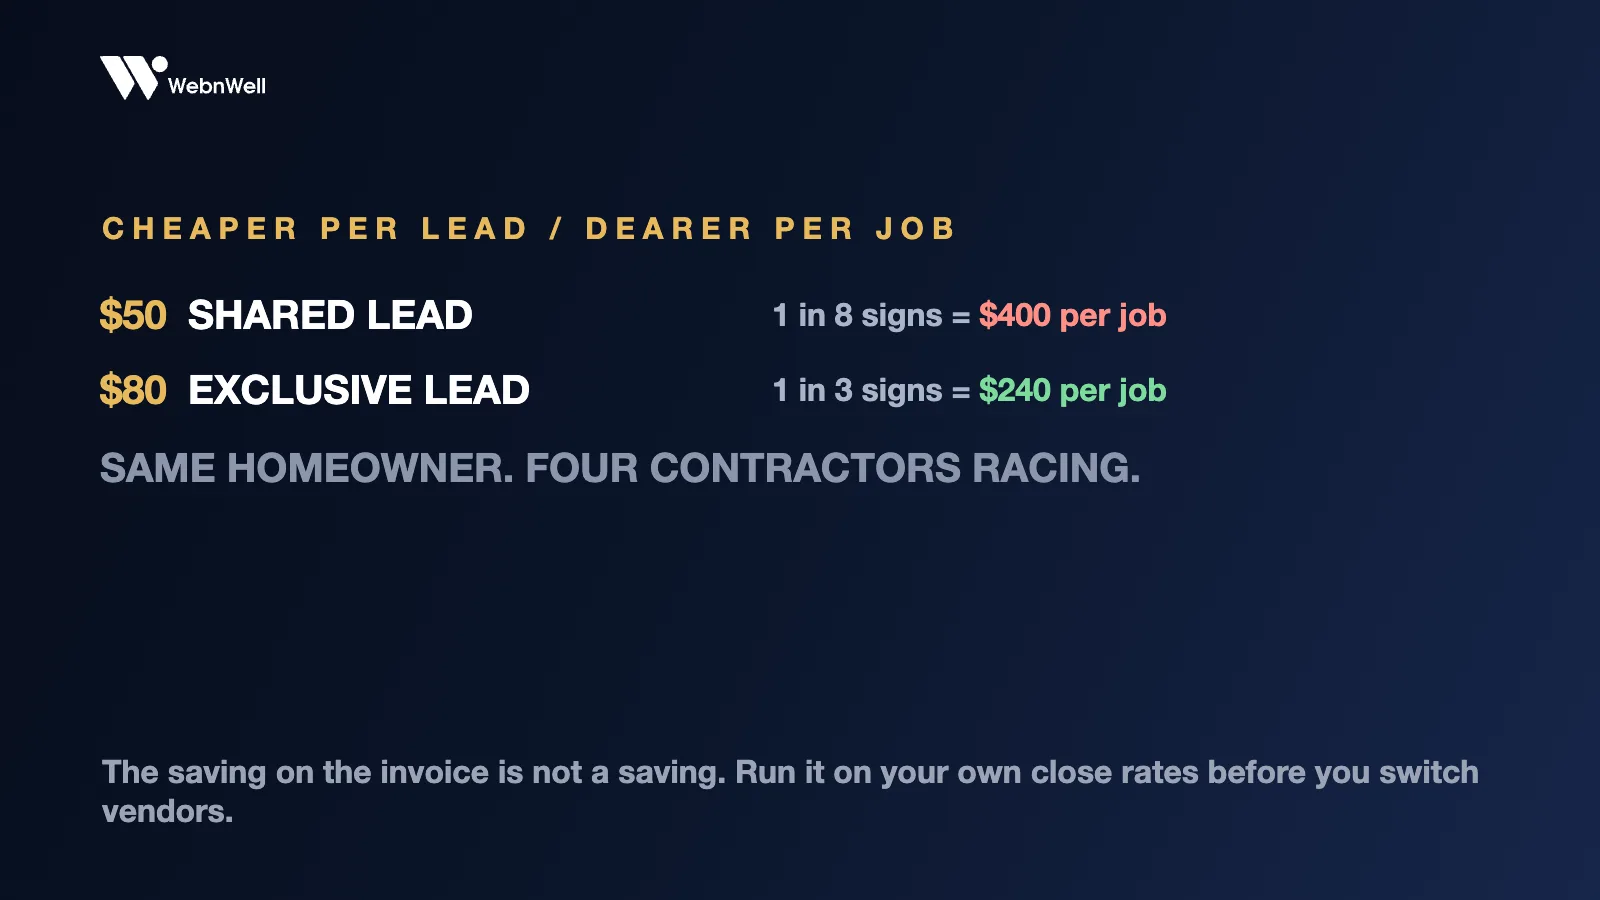
Cheaper per lead, sixty percent more expensive per job. The full argument on shared versus exclusive is here with the math, but the napkin already told you the headline.
The three leaks, in the order they drain you
Go back to the walkthrough month. Four of ten leads were never reached. That’s $320 of the $800 gone before anyone had a chance to sell, and it is nearly always a speed problem: the homeowner who filled a form at 2pm had hired someone by the time you called Thursday. Answering inside five minutes is the cheapest fix in this entire post, because it costs a process change and nothing else.
The second leak is quieter. Three quotes went out and two died in silence, and most owners let them die, because the quote answered the homeowner’s last question and gave her no reason to reply. Two follow-ups with an actual reason attached recover deals that were never really lost. Any questions on the scope. We can still hold that lead time. That’s the whole technique.
The third leak is paying for people who were never customers: out of your area, wrong trade, solicitors. On pay-per-lead platforms you dispute those weekly and get credited. On Google Ads you block them up front with negative keywords. Five minutes a week either way, and the owners who skip it donate money every month without ever seeing the line item.
What the number is for
Once you know cost per job by channel, ranking your channels stops being guesswork:
| Channel | Cost per lead | Typical close | Cost per job |
|---|---|---|---|
| Shared leads | Lowest | One in six to ten | Usually the worst |
| Local Services Ads | Fixed | Strong, badge trust | Usually solid |
| Search ads to your page | Highest per click | Best, they chose you | Often the best |
| Repeat and referral | Near zero | Highest of all | Untouchable |
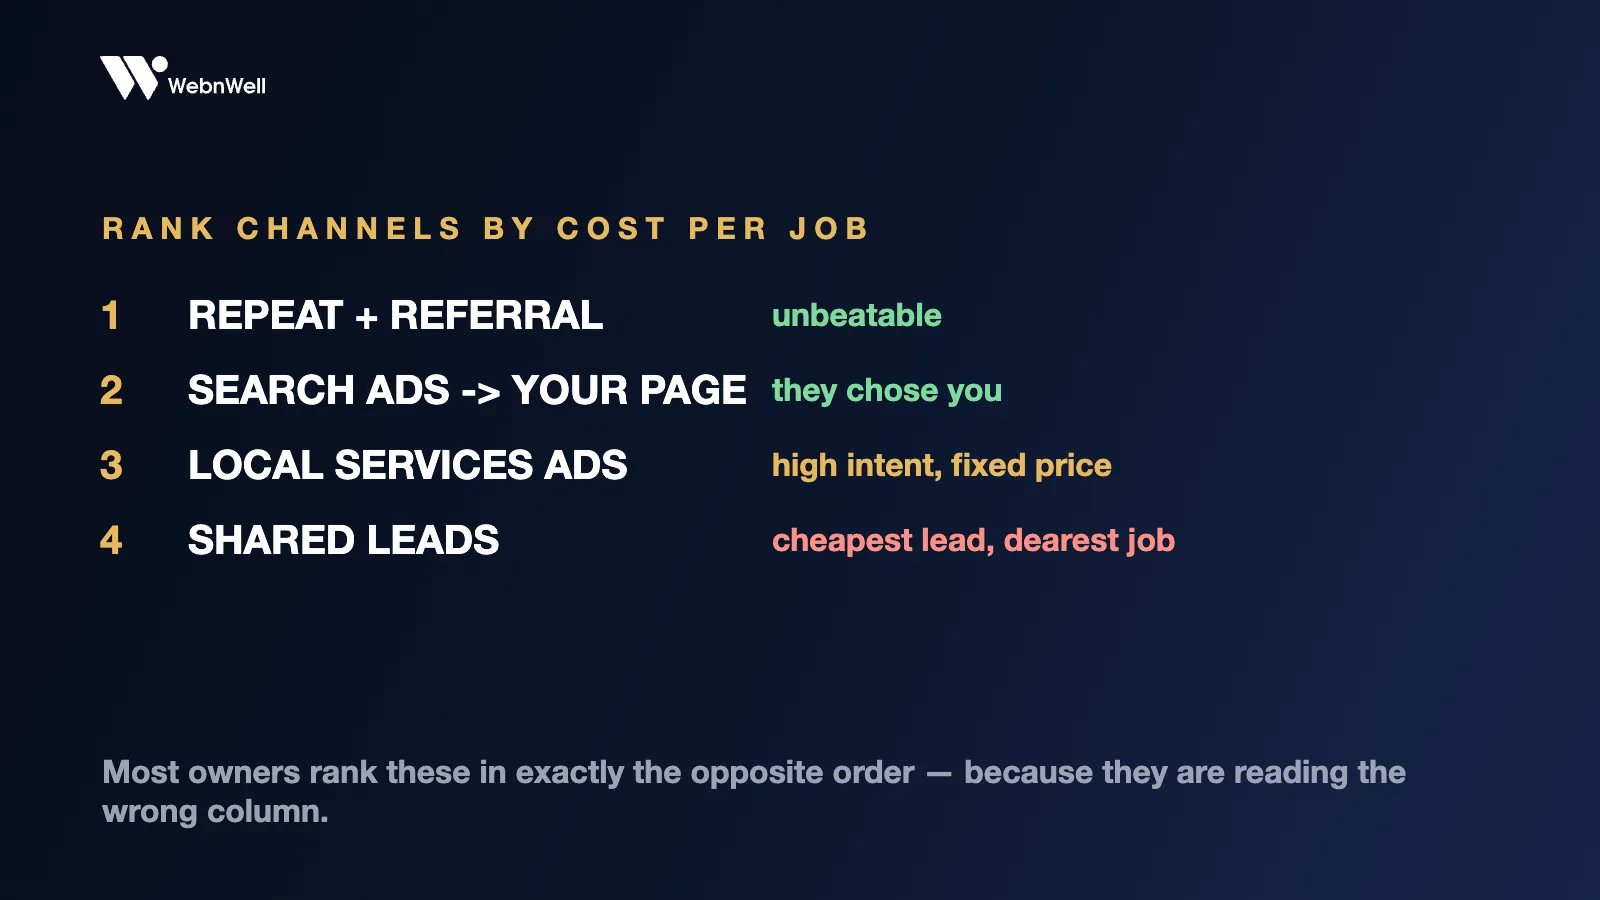
Read the last column only. It frequently reverses the first.
The Friday sheet
Tracking this needs no software. A sheet, five columns, filled in Friday afternoons: date, source, reached yes or no, quoted and for how much, signed and for how much.
Thirty rows in, you’ll know more about your marketing than any dashboard has ever told you. The columns are the leaks, so when a month comes back ugly the sheet points at the stage that broke, and you fix a process instead of blaming the ads.
Start it this Friday. Then, if you want your market’s version of these numbers rather than my walkthrough’s, the free audit maps what leads cost in your city and where your cost per job would realistically land. I record it as a video against your actual results page, and the numbers stay yours either way.